This week: Quantify data from open-ended questions.
Open-ended questions give phenomenal insights into how people think, feel, and behave. However, it can be tedious and time-consuming to quantify peoples’ responses. As an NLP-powered human response platform, we made it our mission to make categorizing qualitative data fast, effective, and easy for marketers and researchers alike. Here’s how to get started.
First and foremost, Glimpse already helps you quantify peoples’ true opinions in a conversational way using automated topics. However, if you notice a trend in your data and want to create a topic, you can do the following.
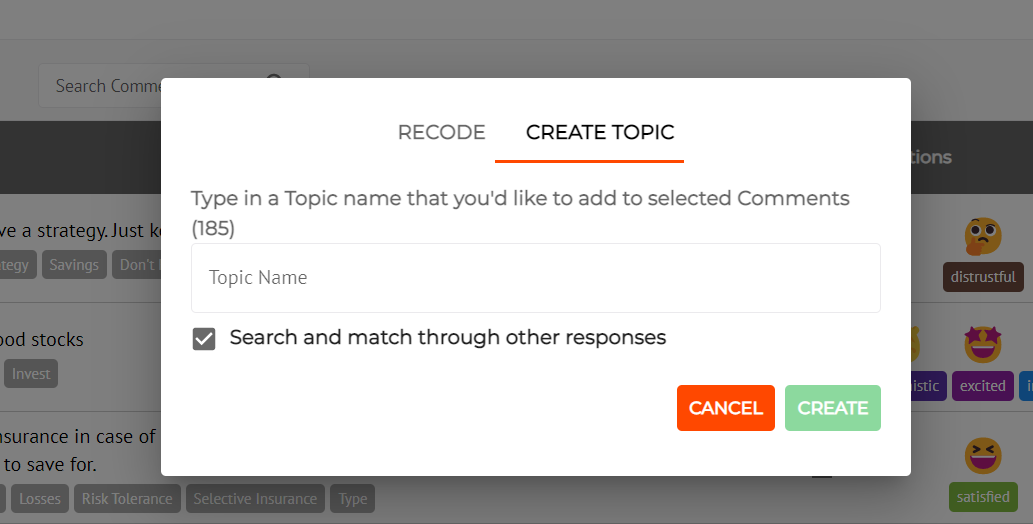
Click “Expand” next to an open-ended question (marked TT) in your completed study. Scroll down to the Comments section and select the comments that fall under that unique topic or trend. Once selected, locate the gear icon in the top right corner of the Comments section. Select “Edit selected comments” and then click “Create a Topic”.
Your new topic will be added to your Tree Table, allowing you to view user data about the people under that topic, such as political affiliation, age, hobbies, and more!
Try out this feature on Glimpse using a private or public study!